Filtering data in Visualizer
Use the Filters bucket in Chart Builder to filter the data in one of the following ways:
- Drag and drop a measure or attribute from the Subject Area onto the Filters Bucket.
- Filter on measures and attributes that have already been added to the report, as described in the following section.
- Alternatively, you can also visually filter a report by dragging a capture rectangle around attribute values in the chart. See Visually Filtering - Drag-Select and Pie/Donut .
Tip: When starting a new report, you can add a measure or attribute to the filters bucket first and configure the filter before adding the measures and attributes. The filter will be applied to any measures and attributes that you subsequently add.
Important! Set-based filters (BQL IN, NOT IN) are not supported in Visualizer.
Filter data in a report
In Visualizer, add one or more measures and attributes to plot a chart.
- Search for, or drag and drop a relevant column onto Filters on the Chart Builder column and then click the chart.
- Select
the Filters icon the Chart Builder
column.
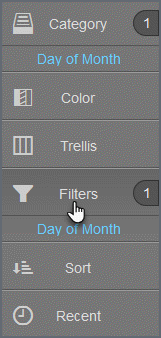
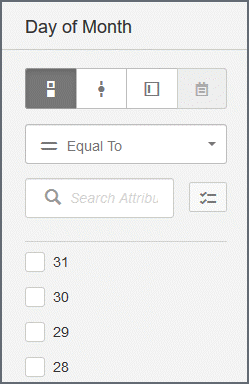
- Select
the filter style (styles are based on the data type):
- Check list (check box): Use for multi-select text-based or numeric data types.
- Slider: Use for date, date time, and integer data types.
- Value: Use for text-based data.
- Date
picker: Use for date data types.
Note: The Filter Editor lists the first 100 values. You can find additional values using search.
- Click the filter.
- Select
the filter operator.
- Select values
from the list and use the operators to specify a filter set.
- If there is
a long list, use one of the following:
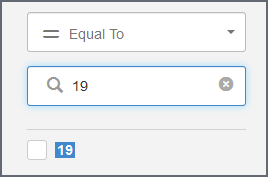
- Use search to find the values you need.
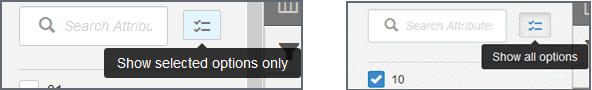
- Click
'Show selected options only'.
Click it again to see and scroll the first 100 options.
- Use search to find the values you need.
- If there is
a long list, use one of the following:
- Select values
from the list and use the operators to specify a filter set.
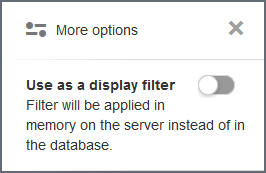
- If you want the filter to apply against the query result set in memory, select More options > Use as a display filter.
- By default,
the filter operation is carried out at the data source. If you want the
filter to apply against the query result set in memory, select More Options.
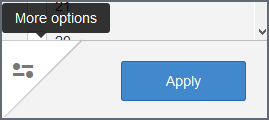
- Then slide the filter to on.
- Click Apply.
- Click the Filter bucket to see the current filter.
Tips:
- Toggle the filter on and off using the toggle switch . In a dashboard, when a filter is toggled off it maintains its state, but it is not applied to the dashboard.
- To change the filter condition, click on the filter name in the Filters bucket.
- A report can have multiple filters.
- A filter column does not have to be in the Category bucket; it does not have to display in the report. If you want to filter on a column you are already using in your chart, you can drag the column from its current bucket to the Filters bucket. Visualizer will not remove it from the current bucket and will add it to the Filters bucket.
- You can remove the filter by clicking the Remove icon.
- You can use a Visualizer report expression as a filter by dragging and dropping it to the Filters bucket. However, you cannot filter the data in a report using a saved expression created in Designer.
- To filter on date type attributes, use the range (between) condition and the date picker.
- Text-based value filters can have multiple values separated by a delimiter. Toggle Allow Multiple Values and specify the values and what delimiter to use.